Plotly Compilations
Area Plot
| Example | Description |
|---|---|
|
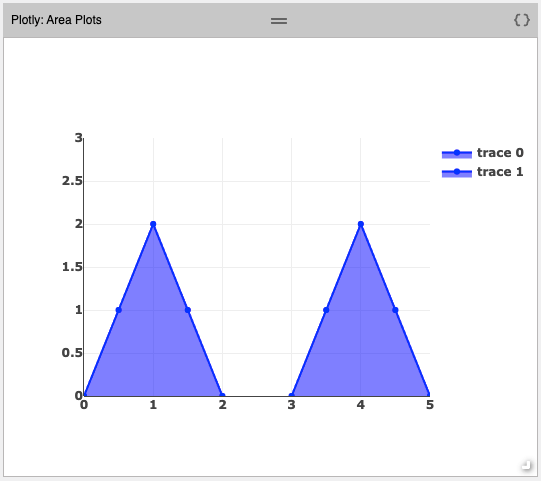
Area Plot with Stacked DataIn this compilation, the Plotly widget is used to display a basic area plot, where the data is stacked. |
|
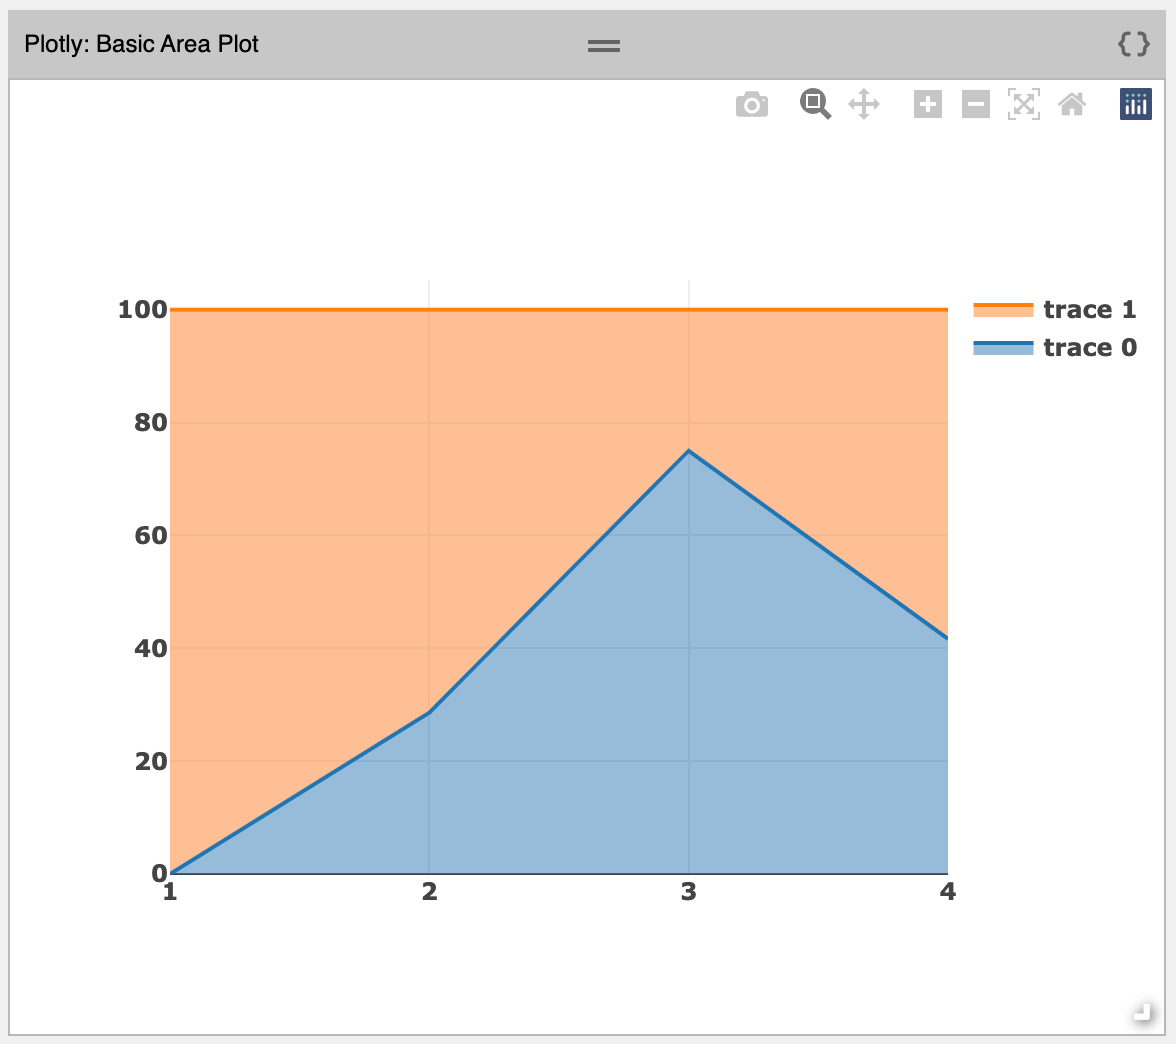
Basic Area PlotIn this compilation, the Plotly widget is used to display a basic area plot. |
Bar Chart
| Example | Description |
|---|---|
|
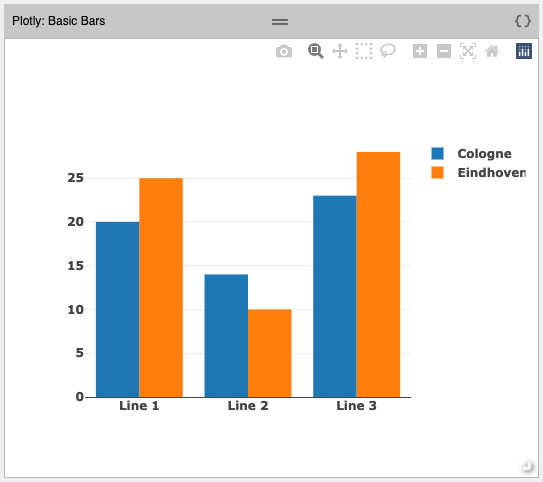
Simple Bar ChartIn this compilation, the Plotly widget is used to display a basic bar chart. |
|
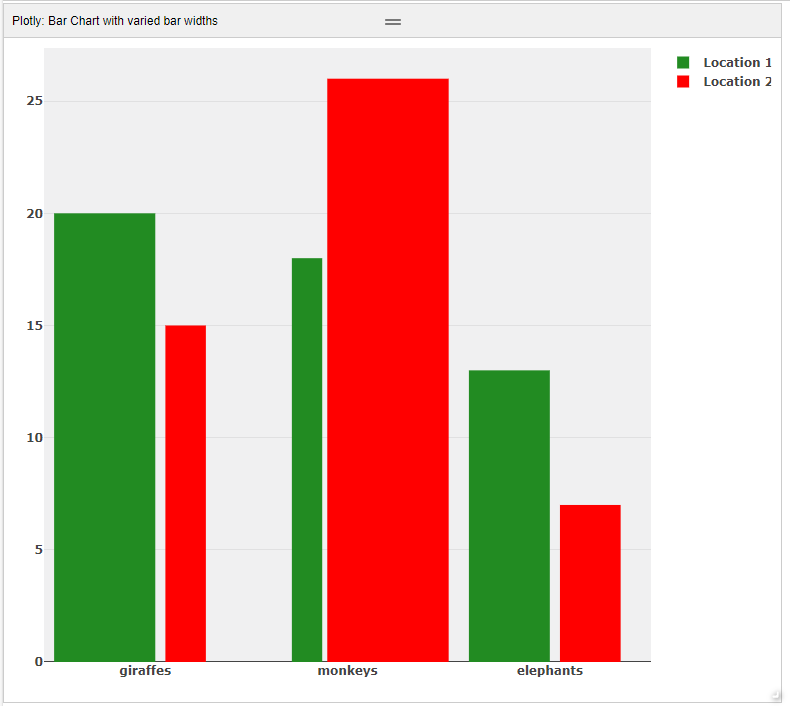
Bar Chart with Variable Bar WidthsIn this compilation, the Plotly widget is used to display a basic bar chart, where the bars have variable widths. |
|
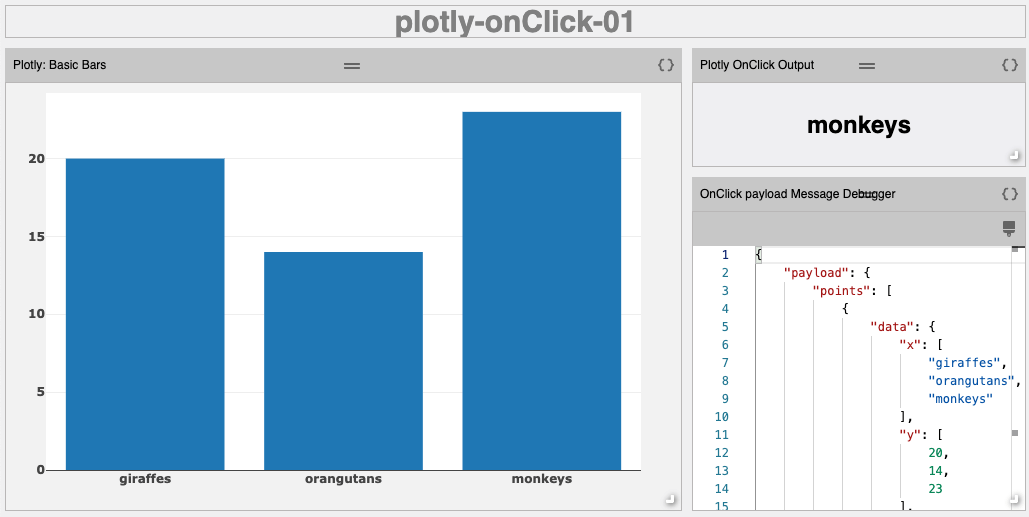
Bar Chart with
|
Box Plot
| Example | Description |
|---|---|
|
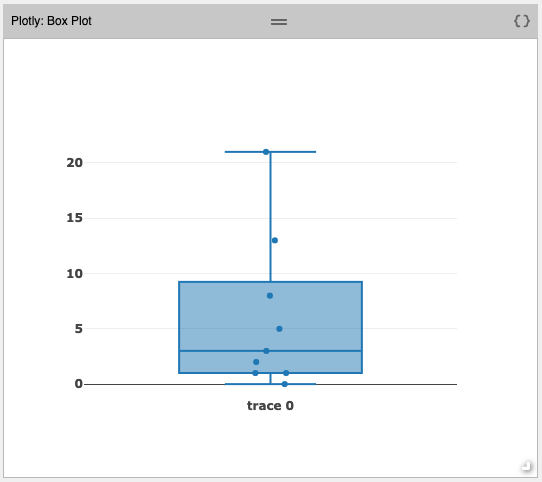
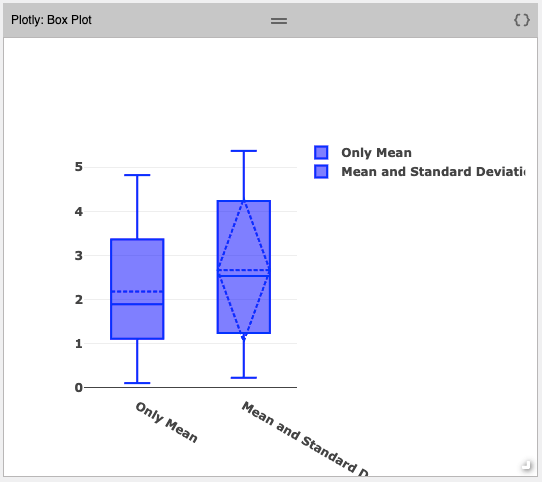
Simple Box PlotIn this compilation, the Plotly widget is used to display a simple box plot diagram. |
|
Box Plot with Standard DeviationIn this compilation, the Plotly widget is used to display a box plot diagram, which includes the mean and standard deviation. |
Gauge
| Example | Description |
|---|---|
|
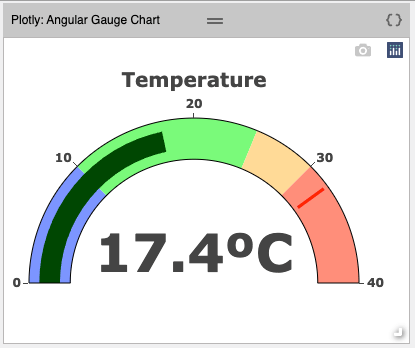
Basic Angular GaugeIn this compilation, the Plotly widget displays a basic angular gauge diagram. |
|
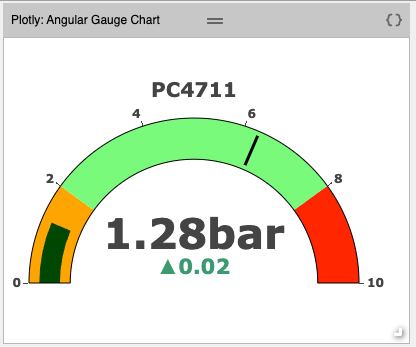
Data Bound GaugeIn this compilation, the Plotly widget displays a data bound gauge. In addition to the value, the gauge delta and threshold are also updated when a new value is received. |
Histogram
| Example | Description |
|---|---|
|
Basic HistogramIn this compilation, the Plotly widget is used to display a histogram. |

Line Chart
| Example | Description |
|---|---|
|
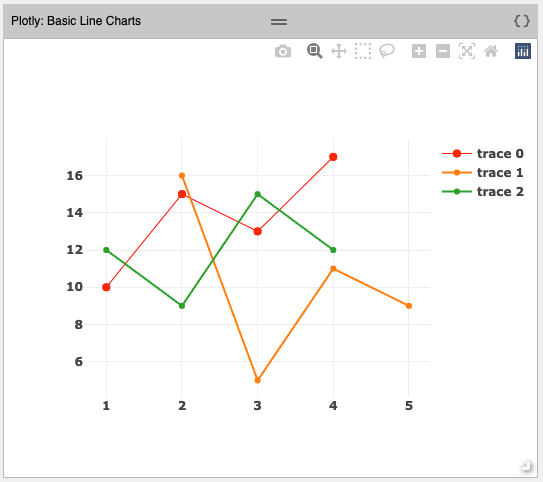
Simple Line ChartThe Plotly widget in this compilation is used to display a basic line chart, where the data is defined in the widget model. |
Pie Chart
| Example | Description |
|---|---|
|
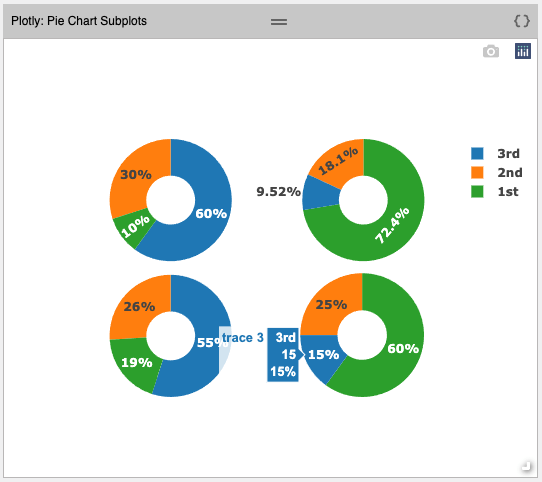
Pie Chart with SubplotsIn this compilation, the Plotly widget is used to display a pie chart with subplots. |
Scatter Plot
| Example | Description |
|---|---|
|
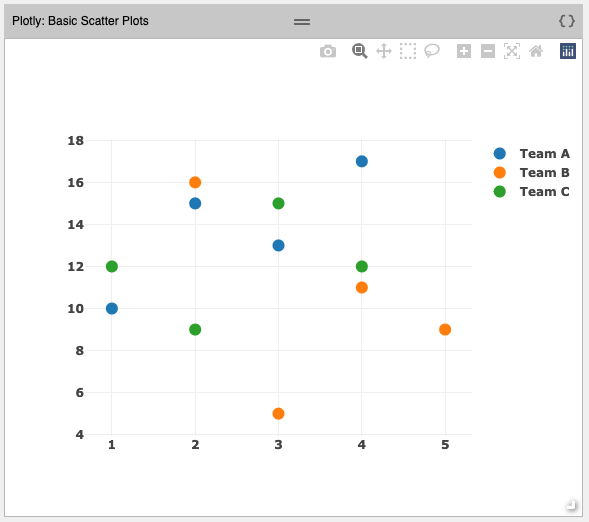
Basic Scatter PlotThe Plotly widget in this compilation is used to show a basic scatter plot. |
|
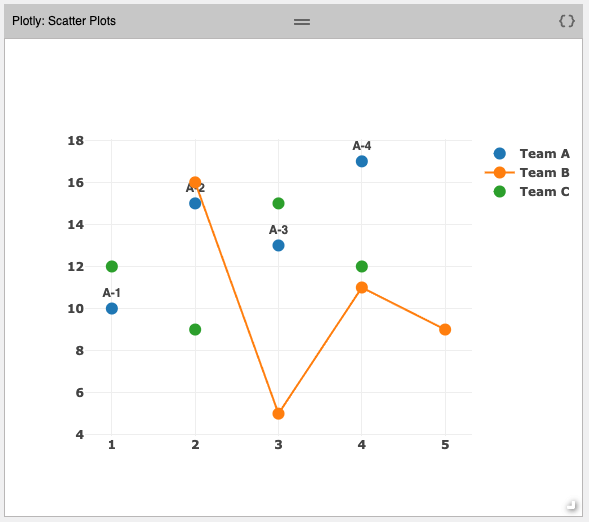
Scatter Plot with Markers and LinesIn this compilation, the Plotly widget is used to show a scatter plot with markers and lines. |